BM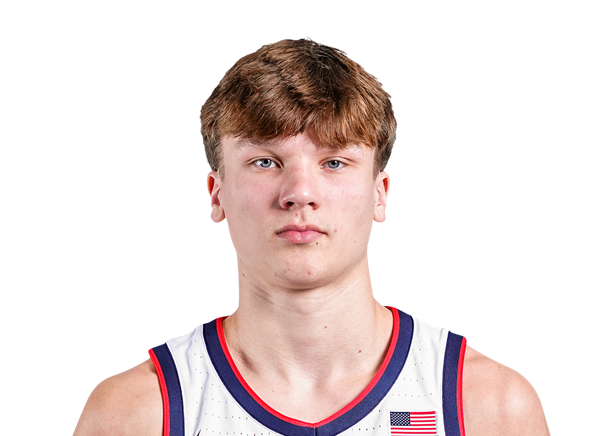
2027 NBA Draft · Wing
Braylon Mullins
UConn · Sophomore
 UConn · Sophomore
6′6″ · 196 lb · Draft age 21.2 yrs
ESPN100 #17Compare
- T4P
- #9
- Market
- #18 · range 11–19 · 4 boards
- Mock
- #18 BRK
2026–27 · Big East · 5 G · 28.8 MPG
- PTS / G
- 20.8
- REB / G
- 3.0
- AST / G
- 1.6
- FG%
- 41.4%
- 3P%
- 38.0%
- FT%
- 84.4%
Your tier
Statistical benchmarks
2026–27 · Big East · vs. drafted prospects in T4P80th and up20th and below
Scoring
- PTS/3626.099th percentile for PTS/36
- TS%61.8%75th percentile for TS%
Shooting
- 3PM/364.8100th percentile for 3PM/36
- 3P%50 3PA38.0%66th percentile for 3P%
- FT%32 FTA84.4%89th percentile for FT%
Playmaking
- AST/362.037th percentile for AST/36
- AST/TO0.8732nd percentile for AST/TO
- TO/362.353rd percentile for TO/36
Defensive box stats
- STL/361.032nd percentile for STL/36
- BLK/360.537th percentile for BLK/36
- PF/362.558th percentile for PF/36
Rebounding
- ORB/360.57th percentile for ORB/36
- DRB/363.313th percentile for DRB/36
- REB/363.89th percentile for REB/36
How these percentiles work
Each metric ranks this season against drafted prospects in T4P, each counted once at their latest played season, with at least 20 of them per metric. Leagues and positions are pooled with no league adjustment and no minimum attempts. Lower TO/36 and PF/36 rank higher. A percentile describes the season’s production and makes no claim about NBA projection.
Small sample marks a season of 1 to 4 games, or one with under half the median games of his draft class’s stored seasons once that median reaches 10.
Statistics
Every season, newest firstPer game
| Season | G | MPG | PTS | REB | AST | STL | BLK | TO | PF | FG M–A | FG% | 3P M–A | 3P% | FT M–A | FT% |
|---|---|---|---|---|---|---|---|---|---|---|---|---|---|---|---|
| 2026–27UConn · Big East | 5 | 28.8 | 20.8 | 3.0 | 1.6 | 0.8 | 0.4 | 1.8 | 2.0 | 5.8–14.0 | 41.4% | 3.8–10.0 | 38.0% | 5.4–6.4 | 84.4% |
| 2025–26UConn · Big East | 33 | 28.3 | 12.0 | 3.5 | 1.4 | 1.0 | 0.6 | 1.2 | 2.8 | 4.4–10.5 | 42.1% | 2.2–6.5 | 33.5% | 1.0–1.1 | 88.9% |
Swipe for all 16 columns →
Per 36 minutes
| Season | PTS | REB | AST | STL | BLK | TO | PF | FG M–A | 3P M–A | FT M–A |
|---|---|---|---|---|---|---|---|---|---|---|
| 2026–27UConn · Big East | 26.0 | 3.8 | 2.0 | 1.0 | 0.5 | 2.3 | 2.5 | 7.3–17.5 | 4.8–12.5 | 6.8–8.0 |
| 2025–26UConn · Big East | 15.3 | 4.5 | 1.8 | 1.3 | 0.8 | 1.5 | 3.6 | 5.6–13.4 | 2.8–8.3 | 1.2–1.4 |
Swipe for all 11 columns →
Advanced
| Season | TS% | eFG% | 2P% | 3PAr | FTAr | AST/TO | USG% | ORtg | DRtg | BPM | Rim% | Non-rim 2P% |
|---|---|---|---|---|---|---|---|---|---|---|---|---|
| 2026–27UConn · Big East | 61.8% | 55.4% | 50.0% | 0.71 | 0.46 | 0.87 | 28.5% | 124.0 | 96.2 | +4.8 | — | — |
| 2025–26UConn · Big East | 54.6% | 52.2% | 54.9% | 0.62 | 0.10 | 1.20 | 20.1% | 111.2 | 100.4 | +6.1 | 56.0% | 56.1% |
Swipe for all 13 columns →
Column definitions
- G · MPG
- Games played; minutes per game (season minutes ÷ G). Some season minutes are estimated from the source’s MPG × G.
- PTS · REB · AST · STL · BLK · TO · PF
- Points, total rebounds, assists, steals, blocks, turnovers, personal fouls. Per game = count ÷ G. Per 36 = count × 36 ÷ minutes.
- FG · 3P · FT M–A
- Makes–attempts. FG includes threes. 0–0 is a known zero.
- FG% · 3P% · FT%
- Makes ÷ attempts. Blank (—) when attempts are unknown or zero.
- TS%
- PTS ÷ [2 × (FGA + 0.44 × FTA)].
- eFG% · 2P%
- (FGM + 0.5 × 3PM) ÷ FGA · (FGM − 3PM) ÷ (FGA − 3PA).
- 3PAr · FTAr · AST/TO
- 3PA ÷ FGA · FTA ÷ FGA (can pass 1.00) · AST ÷ TO.
- USG% · ORtg · DRtg · BPM
- Torvik estimates for the same season: share of team plays used on court; points produced and allowed per 100 possessions; box plus-minus per 100 vs. average. Torvik counts Division I games, so its sample can be narrower than the box line.
- Rim% · Non-rim 2P%
- Twos at the rim, and every other two, by the provider’s zones.
Game log
2026–27
5 of 5 games stored · Big East
| Date | Opponent | Result | MIN | PTS | REB | AST | STL | BLK | TO | PF | FG M–A | 3P M–A | FT M–A |
|---|---|---|---|---|---|---|---|---|---|---|---|---|---|
| Nov 18 | @ Arizona | L 79-85 | 36 | 29 | 5 | 0 | 1 | 1 | 2 | 3 | 8–21 | 6–15 | 7–8 |
| Nov 13 | vs Ohio State | W 84-68 | 32 | 22 | 0 | 3 | 0 | 0 | 3 | 3 | 7–13 | 5–9 | 3–5 |
| Nov 9 | vs Wagner | W 83-41 | 24 | 10 | 4 | 4 | 0 | 1 | 2 | 0 | 2–12 | 1–9 | 5–6 |
| Nov 6 | Michigan | W 85-77 | 27 | 23 | 4 | 0 | 1 | 0 | 1 | 3 | 5–12 | 3–8 | 10–11 |
| Nov 2 | vs Gardner-Webb | W 86-46 | 25 | 20 | 2 | 1 | 2 | 0 | 1 | 1 | 7–12 | 4–9 | 2–2 |
Swipe for all 14 columns →